The time it will do in a shell
17 September 2020 | Written by La redazione
Rebuilt the history of climate on Earth over the past 66 million years

A team of international researchers including Professor Claudia Agnini of the Department of Geosciences of the University of Padua recently published the study entitled “An astronomically dated record of the earth’s climate and its predictability in the last 66 million years ”which has made it possible to reconstruct in detail the history of the climate on Earth over the last 66 million years.
The uniqueness of the research lies in having used the most precious geological archive available: sediments from the ocean floor. Thus the most complete high-resolution paleoclimatic dataset available today was created: the CENOGRID (CENOzoic Global Reference benthic foraminifer carbon and oxygen Isotope Dataset) which draws the new climate reference curve. Information on the ancient climate was deduced from the shells of benthic microorganisms, the foraminifera, by measuring their isotopic composition (oxygen and carbon).
An innovative approach. Another innovative research approach is the use of statistical analysis in the quantification of recurrences. The latter, applied to dynamic systems such as the climatic one, provided the orbital forcing (the effect on the climate of changes in the inclination of the Earth’s axis and in the orbit of our planet) linked to variations due to long insolation. In this way, four climatic states have been determined in the last 66 million: hothouse, warmhouse, coolhouse and icehouse. The hothouse phase is documented to be around 50 million years old and represents the hottest period in the Cenozoic interior, this is anticipated and followed by two warmhouse phases. Starting 34 million years ago, the coolhouse phase begins, followed by the icehouse phase, which are characterized by the establishment of the Antarctic and Arctic ice sheets.
The experience of the past. What becomes important, through research, is to possess the data of the hothouse phase with certainty. We now know more precisely when the planet was warmer or colder, and we also have a better understanding of the underlying dynamics. In fact, in a context of global change, such as the current one, it will be possible to simulate the most pessimistic scenarios published by the IPCC (Intergovernmental Group on Climate Change) for the next 300 years and that the increase in temperature of about 8 ° C. If the our planet, during the greenhouse phase, has already experienced extreme conditions, the dynamics of the climate system now hypothesized in the dataset of the study will be able to provide valuable information for the construction of ever more precise forecast models.
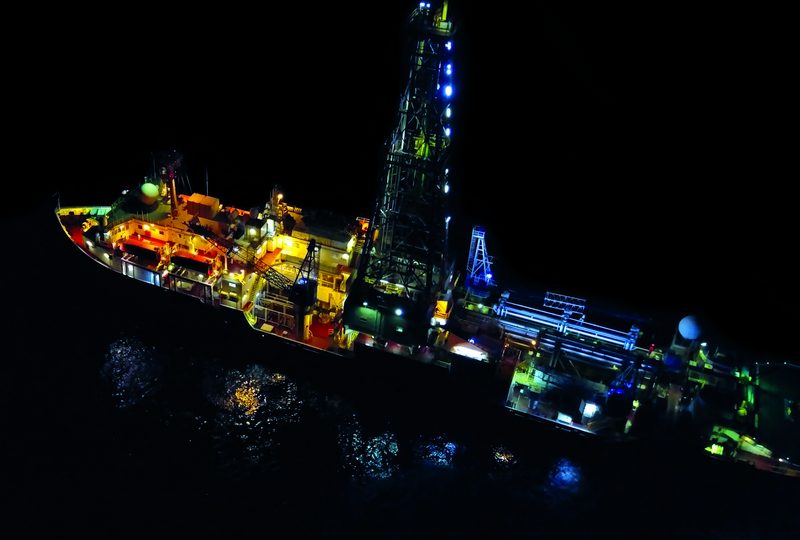
For fifty years the sediment layers drilled around the world on the ocean floor have been classified through the internationally coordinated scientific expeditions of the International Ocean Discovery Program (IODP) and its previous programs (DSDP, ODP, IODP). By studying these sediments and the microfossils within, scientists have been able to reconstruct and analyze global climate change from the distant past. The isotopes of oxygen and carbon provided information on past deep sea temperatures, global ice volumes and the carbon cycle. These clues, stored in the shells of microorganisms that once lived on the seabed, represent an archive of past climatic conditions that researchers use to make comparisons between past, present and future. Over the past two decades, scientific drilling programs have analyzed older geological strata.
The new climate reference curve – called CENOGRID (CENOzoic Global Reference benthic foraminifer carbon and oxygen Isotope Dataset) – is a reconstruction of the Earth’s climate from the last great extinction 66 million years ago, which introduced the Cenozoic.
The model studied has precisely identified astronomical cycles (cycles that lead the Earth to cool or warm) and now the climate of the last 66 million years is continuously intelligible for the first time. It has been shown, as mentioned, that there were four predominant climatic modes in the Cenozoic: hothouse, warmhouse, coolhouse and icehouse.
This classification has long been known, but it was only through statistical analysis of the new data that the team was able to identify the fundamental states and reveal their dynamic characteristics, including changes and hidden patterns. This type of analysis also allows for deductions on the probability of future events: having a knowledge of the last 66 million years is advantageous because it is possible to understand if climatic events or patterns have repeated in the past, if they are due to natural processes, or if they are abnormal and therefore cause for concern.
In the future, the new CENOGRID climate reference curve can serve as a basis for researchers around the world: with more data it is now possible not only to further refine the picture of the climate past, but also to identify regional complexities and test the reliability of climate models for the future.


